Quantifying uplift
Introduction
To quantify the impact of your models, you challenge the models with random actions and track the propensity’s source so that you can report on it later.
Video
Transcript
This video demonstrates how to modify a decision strategy to quantify the impact of your models on the success rate of your actions. This is also known as the uplift.
Consider a basic Next-Best-Action strategy:
The Next-Best-Action is the action with the highest propensity. This propensity is determined by the Prediction strategy component.
In the Prediction strategy, the Adaptive Model component determines the propensity of all offers.
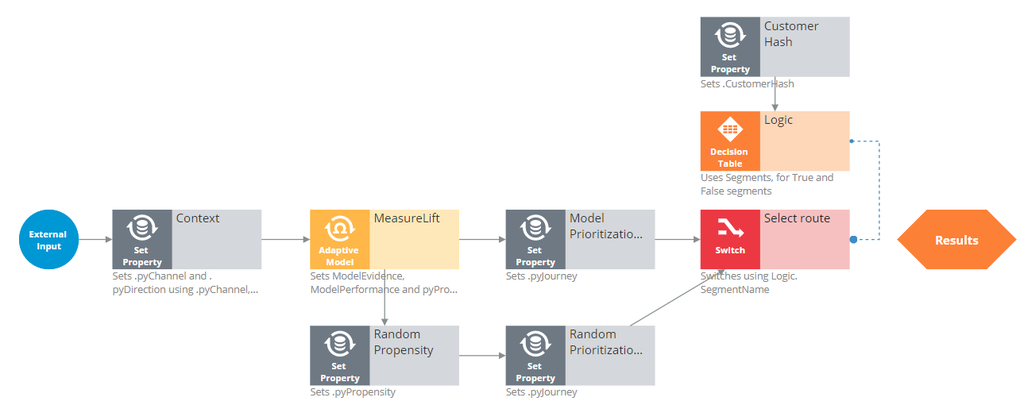
To measure the uplift of your models, you need to modify the Prediction strategy to challenge your models with random actions. The first step is to override the initial propensity generated by the model. You add a Set Property component to the canvas and configure the .pyPropensity property to equal a random number between 0 and 1.
Next, you configure an additional Set Property component to distinguish the random actions from the model-based actions. In this case, we use the .pyJourney property for that purpose. In the Model prioritization component, this property has been set to "Model".
To take 90% model-based actions and 10% random actions, you add a Champion Challenger component and configure it.
To test the new Prediction strategy, open the test panel. For external input, use the Credit Cards component of the Next- Best-Action strategy and run the strategy on Troy. Show the component level values for Propensity. In this case, the propensity generated by the model is propagated. If you run the strategy multiple times, in 1 out of 10 runs the random propensity will be propagated. When the models have learned from captured responses, you can report on the uplift of the models.
In prediction Studio, examine the models generated. Confirm that all models have captured responses.
To report on the uplift of the models, go back to the Customer Decision Hub and open the report browser. To offset the impact of the model-based actions to those based on random actions, the Uplift report is based on the strategy property that reflects the use of either the model route or the random route when determining the next best action. The uplift is the increase in success rate of the model-based actions when compared to random actions. In this example, the uplift is 65%.
When business objectives require the random actions to be consistently taken with a defined segment of the customer base, you can use a customer property to determine the routing through the Prediction Strategy.
In this design pattern, the red Switch component selects either the model route or the random route. The selection is based on a hash code derived from the last two digits of the customer ID, which is used by the Control group component to segment the customers. The Switch component uses these segments to select the model-based or the random action.
You have reached the end of this video, which shows you how to measure the uplift of your adaptive models by challenging the models with random actions.
This Topic is available in the following Module:
If you are having problems with your training, please review the Pega Academy Support FAQs.
Want to help us improve this content?


