Monitoring predictions
Archived
5 Tasks
15 mins
Scenario
In the Summer Sales marketing promotion brief, U+Bank has adopted predictive analytics. The sales manager wants you to report on the uplift of the adaptive models that are employed in the one-to-one customer engagement strategy. To measure the uplift, you modify the prediction strategy to take a random action to a small percentage of the customers as a benchmark.
Use the following credentials to log in to the exercise system:
| Role | Username | Password |
|---|---|---|
| Data Scientist | DataScientist | rules |
Your assignment consists of the following tasks:
Task 1: Train the models
Train the MeasureLift adaptive models by running the MakeDecision and CaptureResponses data flows. This warms up the system by capturing the customer responses to all actions.
Task 2: Confirm model creation
Confirm that four models are generated for the credit card actions.
Task 3: Adjust the strategy
Adjust the PredictionStrategy to take a random action for 10% of the customers.
Task 4: Simulate customer interactions
Run the MakeDecision and CaptureResponsesIH data flows to simulate customer interactions and store the data in Interaction History for reporting on the .pyJourney property.
Task 5: Report on uplift
Report on the uplift of the models.
Challenge Walkthrough
Detailed Tasks
1 Train the models
- Log in as Data Scientist with user name DataScientist and password rules.
- In the navigation pane on the left, click Data > Data Flows.
- On the Data Flows landing page, click the MakeDecision data flow.
- In the upper right, click Actions > Run and wait until the run finishes.
- Scroll down and check that for each of the 10.000 customers in the source dataset four decisions are made, resulting in 40.000 records in the destination component.
- Return to Customer Decision Hub.
- In the navigation pane on the left, click Data > Data Flows to open the Data Flows landing page
- On the Data Flows landing page, double-click the CaptureResponses data flow.
- In the upper right, click Actions > Run and wait until the run finishes.
- Check that 40.000 responses are captured.
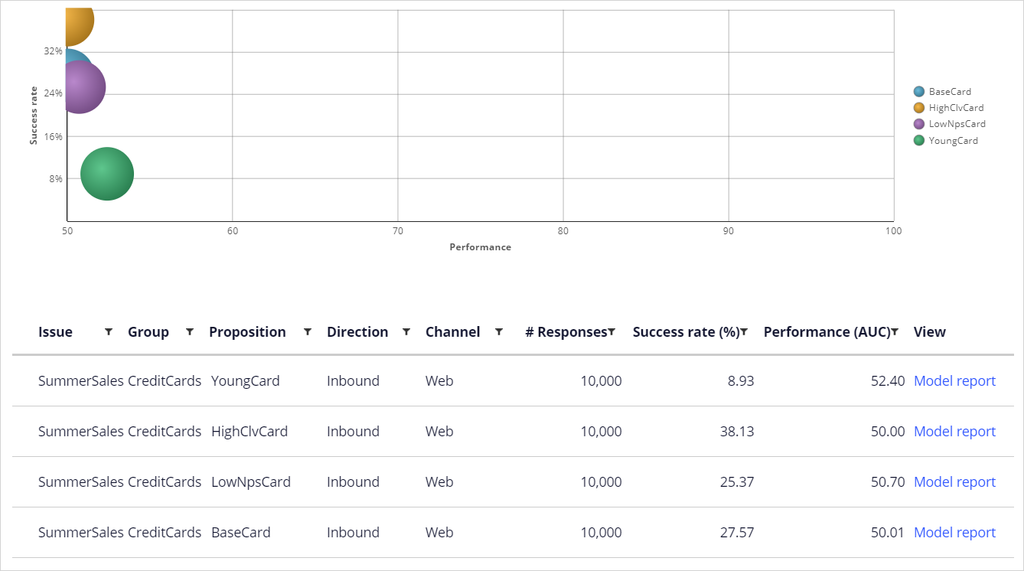
2 Confirm model creation
- In the navigation pane on the left, click Intelligence > Prediction Studio and open the MeasureLift model.
- Click Refresh reporting data to update the models.
- Confirm that each action has received 10.000 responses.
3 Adjust the strategy
- Return to Customer Decision Hub.
- In the navigation pane on the left, click Intelligence > Strategies
- On the Strategies landing page, click SummerNBAStrategy.
- Right-click the Prediction Strategy component, and then select Open strategy.
- Check out the strategy.
- On the strategy canvas, add a Set property component.
- Configure the component with the following information:
- Name: Random Propensity
- Set the .pyPropensity property to equal @Random.random().
- Click Submit.
- On the strategy canvas, copy and paste the Model Prioritization component.
- Configure the component with the following information:
- Name: Random Prioritization.
- Set the .pyJourney property to “Random”.
- Click Submit.
- On the strategy canvas, add a Champion challenger component.
- Configure the component with the following information:
- Name: Challenge Model
- Select Model Prioritization in 90% of the cases and Random Prioritization in the remaining 10%.
- Click Submit.
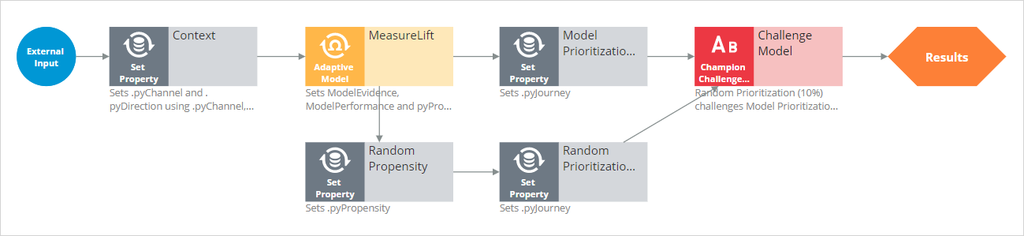
- On the canvas, connect the components to reflect that the Model Prioritization component is used for 90% of the actions, and the remaining 10% use the Random Prioritization components. The strategy should look like the following image:
- On the right, open the Test Run pane.
- Click Settings.
- In the Data transform field, enter or select Troy.
- For external inputs, select SummerNBAStrategy.
- Select the Specify as single component within the strategy check box.
- In the Component list, select CreditCards.
- Click Save & Run.
- Under Show component level values for, select Propensity.
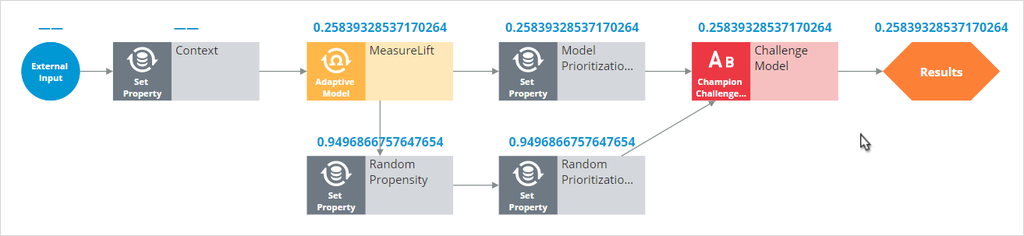
- Check that the Random Propensity component overrides the propensity determined by the model and that the Champion Challenger component propagates one of these two propensities (propensity values may vary).
- Check in the strategy with appropriate check-in comments, and then close the canvas.
- Check out the SummerNBAStrategy.
- On the canvas, open the Prioritize component and change the output to Top 1 to simulate customer interactions.
- In the Test Run pane, click Settings.
- In the Data transform field, enter or select Troy.
- Click Save & Run. Notice that a single action is taken for Troy.
- Check in the strategy with appropriate Check-in comments.
4 Simulate customer interactions
- In the navigation pane on the left, click Data > Data Flows.
- Open the MakeDecision data flow.
- Click Run.
- Confirm that for each of the 10.000 customers in the source dataset a single action is taken.
- Repeat steps 1-3 for the CaptureResponsesIH data flow. Confirm that 10.000 responses are captured.
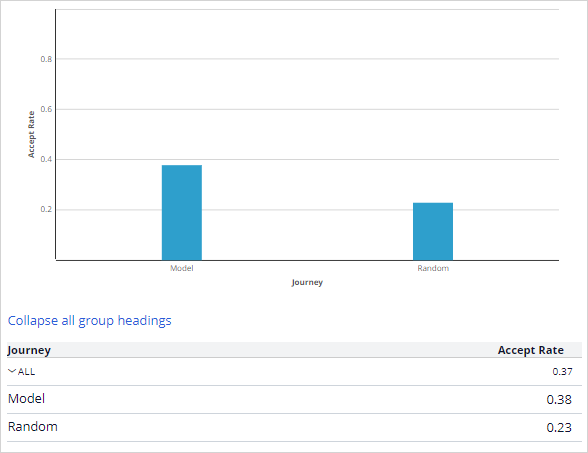
5 Report on uplift
- Return to Customer Decision Hub.
- In the header of Customer Decision Hub, click the Report Browser icon to show recent reports.
- In the Public categories section, click Interaction History.
- Open the Uplift report. Notice the uplift of the models. In this case, the uplift (the increase in the success rate) is around 65% (percentage may vary due to the randomization factor).