Exploring data with insights
The Explore Data reporting tool allows managers to preview and analyze Pega Customer Service™ application data quickly. It enables you to filter and sort data by various criteria and display it using multiple graph types.
For example, a manager can access the information on the handle time of all customer interactions on their team. The manager can then sort it by case type and display the average handle time per available case type. This gives managers a high-level view of what types of service requests take the most time to handle.
You can save a personalized data view as an insight table or chart. It is then listed by data object on the Explore Data landing page.
Insights
Insights transform selected data into tables or interactive charts.
For example, you can represent the average handle time per case type by using a pie chart and enable clickablity on a portion of the pie chart. This interactivity lets you to drill down to the next dimension and display the handle times of individual cases.
The Explore Data tool for Pega Customer Service™ comes with two preconfigured insights:
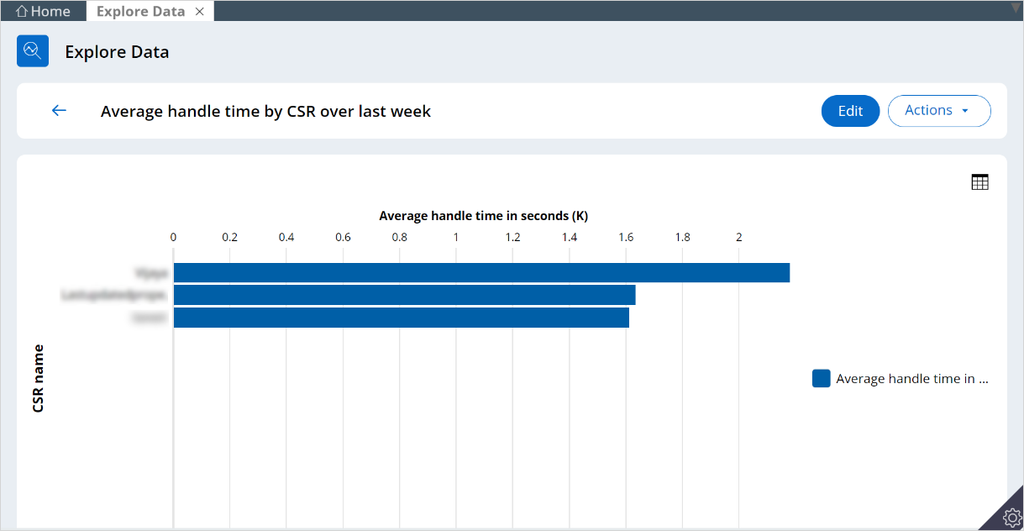
- Average handle time by CSR over last week
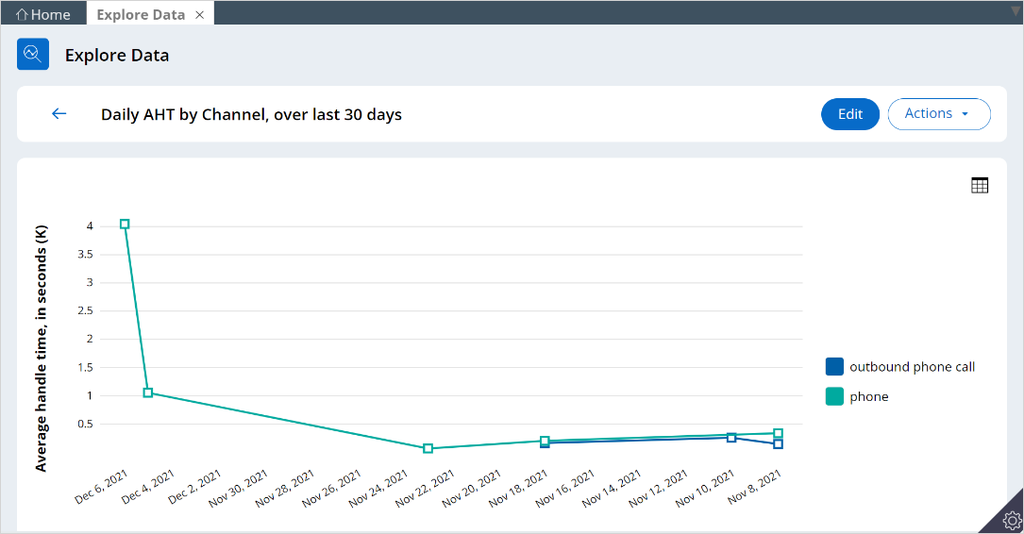
- Average handle time by channel over last thirty days
Explore Data availability
Managers can access the Explore Data tool in the Home menu of the Interaction Portal. For detailed instructions on how to verify if your application meets the requirements to run this tool, see Check for Explore Data readiness section of Explore Data tool | Pega Documentation.
Layout of the Explore Data landing page
The Explore Data landing page displays a list of saved insights.
In the following image, click the + icons in the image to learn more about the actions you can perform on the Explore Data landing page.
View or modify an insight
On the Explore Data landing page, you can select a previously-created insight to view or modify.
In the following image, click the + icons to learn more about the actions you can perform on the Explore Data landing page once you select an insight.
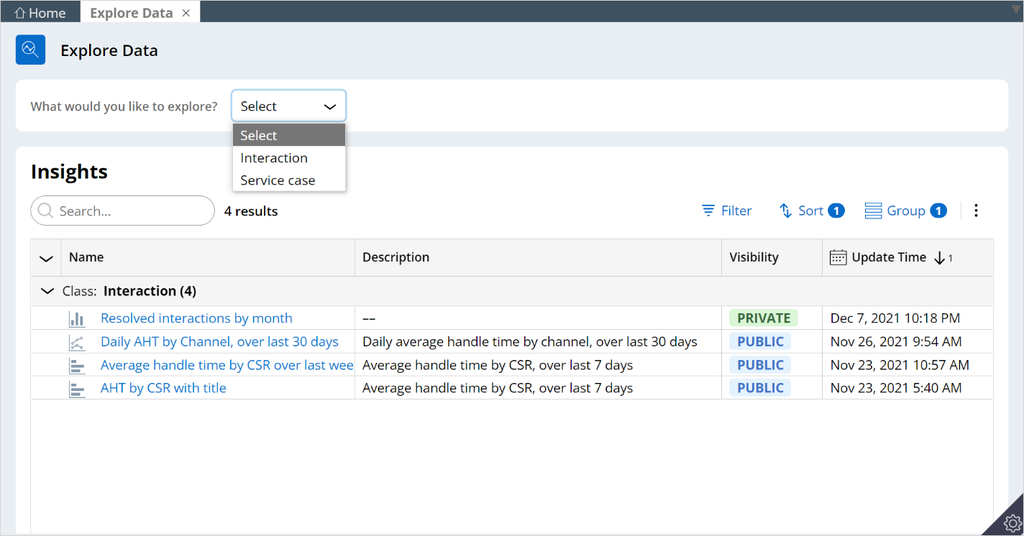
New charts from a data object
On the Explore Data landing page, you can create charts from an insight data object to visualize your data.
The data objects for which you can create a visualization are available in the What would like to explore? list.
In the Action menu, the Create chart option the issue as a customizable chart.
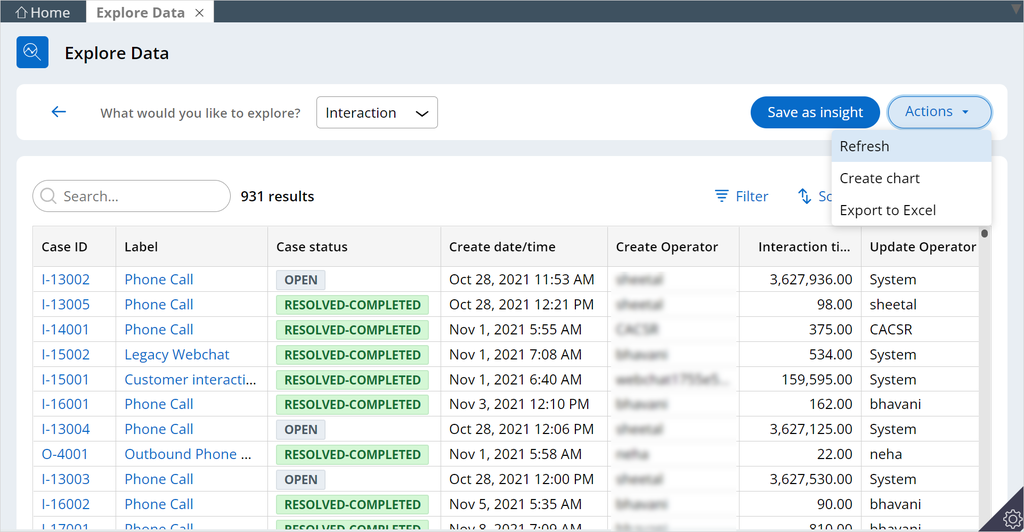
On the chart, you can customize your chart to visualize best the issue that you want to explore. In the following image, click the + icons to learn more about the actions that you can perform when creating a chart.
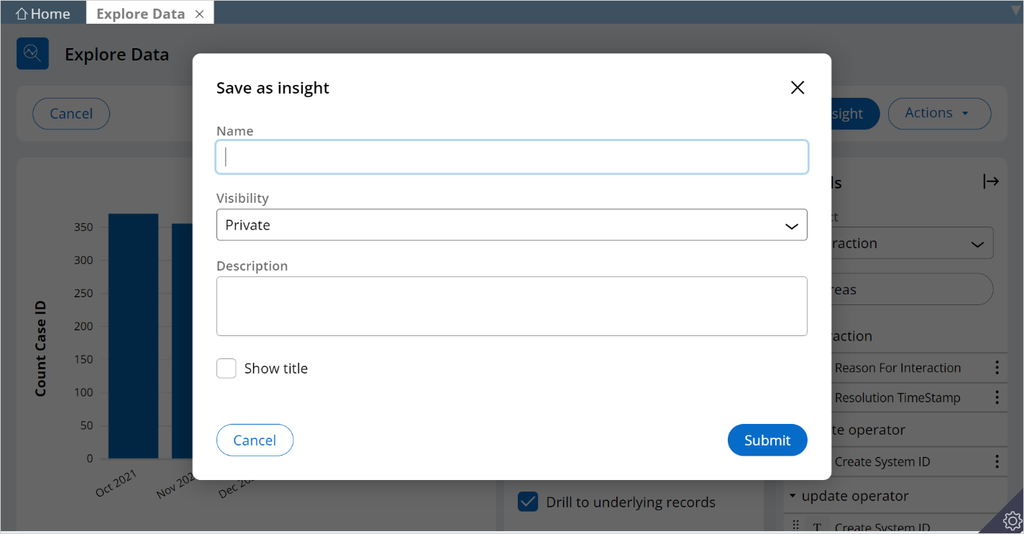
When you complete and save the chart, you have three access options in the Visibility list:
- Public
- Shared
- Private
You can also select whether you want the title of an insight to show at the top of the chart by clicking the Show title checkbox.
This Topic is available in the following Module:
If you are having problems with your training, please review the Pega Academy Support FAQs.
¿Quiere ayudarnos a mejorar este contenido?