Demonstrating adaptive learning
Introduction
In a situation where customer data is not available, you can use a Monte Carlo data set to generate mock data for demonstrating the adaptive learning process. Run a Make Decision data flow to create next-best-action decisions configured in the Next Best Action Designer. Run a Capture Response data flow to simulate customer responses and train the adaptive models. Demonstrate that adaptive models accurately pick up on strong predictors of customer behavior.
Video
Transcript
This video will show you how to demonstrate the accuracy of an adaptive model’s learning process when no real-time customer data is available. Consider this scenario: U+ Bank wants to promote their credit card offers on their website.

Adaptive analytics is used to present a personalized banner to a customer who logs in. U+ Bank would like a demonstration of the accuracy of the adaptive model’s learning process. However, no large customer data set is available yet. To demonstrate the adaptive learning process, use the Pega Customer Decision Hub portal. Demonstrating adaptive learning is a three-step process involving three data flows: prepare the customer data, make a decision for each customer and capture the responses for each customer. A Data flow is a scalable and resilient data pipeline that is used to ingest, process, and move data from one or more sources to one or more destinations.
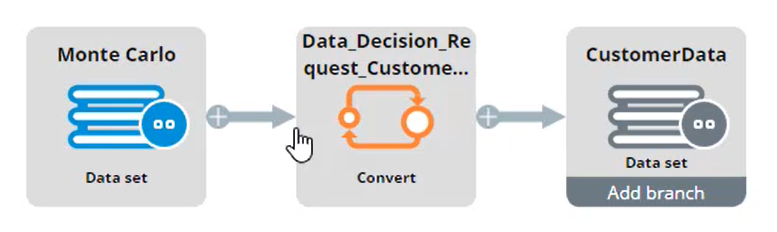
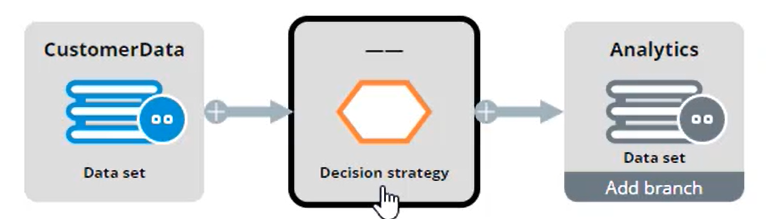
Each data flow consists of a set of interconnected components. The blue source component ingests the customer data, the orange components transform the data which is then moved to the grey destination component. To perform the demonstration, the ‘Prepare Customer Data’ data flow ingests a simulated customer data set. The referenced data set is a Monte Carlo data set with 10,000 records.
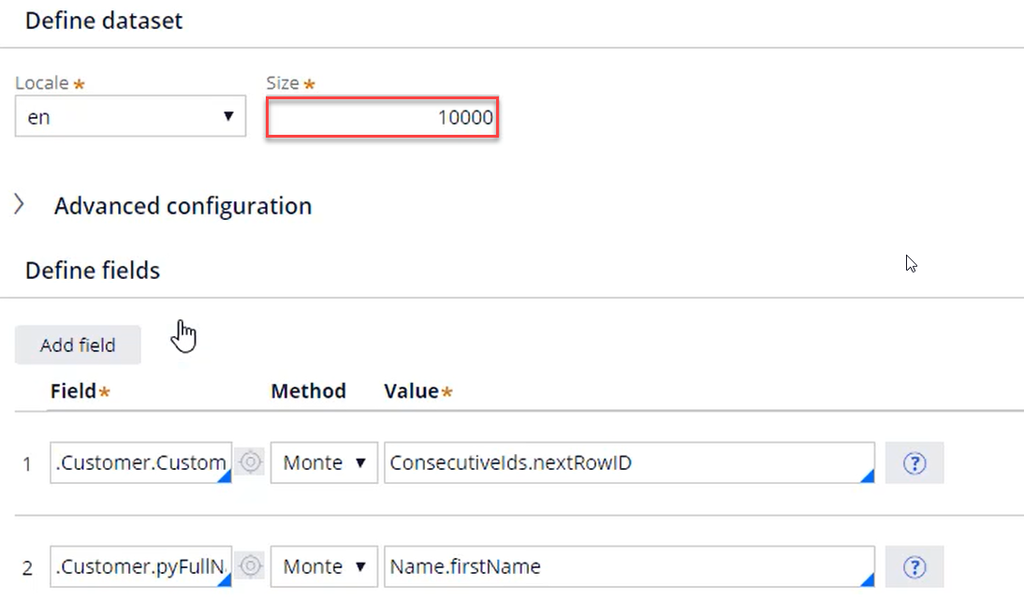
The data set ensures that all customer fields, such as CustomerID, Name, Age, Gender etc., have proper values. Next, the Convert component sets pySubjectID equal to the CustomerID from the Monte Carlo data set.
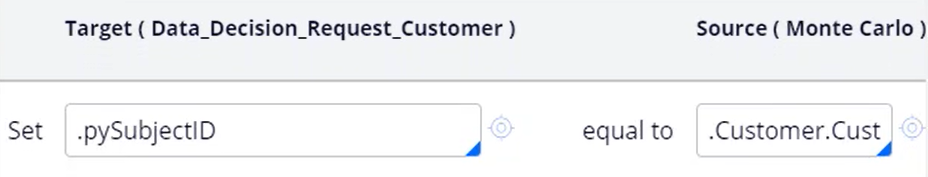
It is a convention to use the pySubjectID property to uniquely identify a customer during the ‘Make Decision’ and ‘Set Response’ processes. The destination is a data set of type ‘Decision data store’ that will serve as the customer base on which to train the adaptive models. By running the data flow, the ‘CustomerData’ data set is populated.
The second data flow, ‘Make Decision’, uses this ‘CustomerData’ data set as its data source.
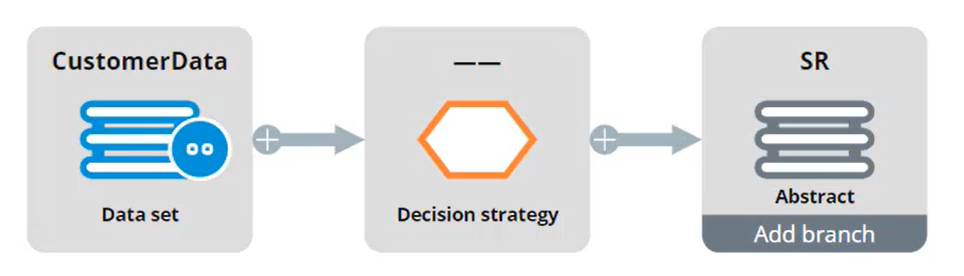
You can Preview the first 10 records of a component. All 10,000 records, including the pySubjectID, are now available in the CustomerData dataset. This customer data is passed to the second component, the Decision Strategy component. This component references the top-level Next-Best-Action Designer trigger strategy that is used to present offers on the U+ Bank website.
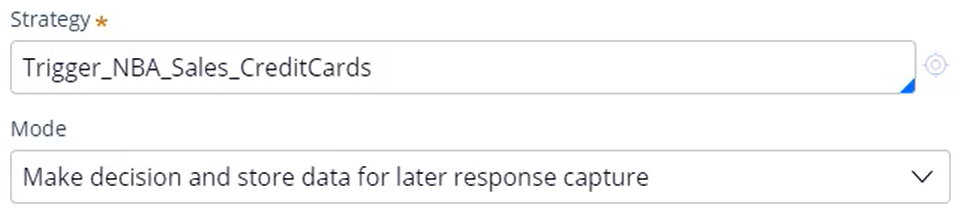
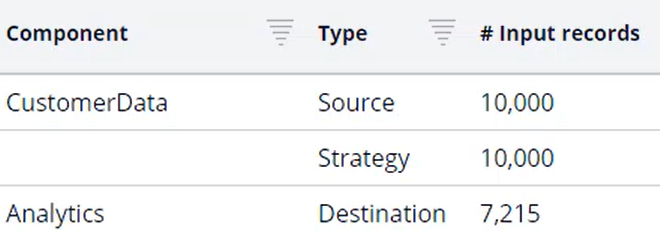
When executing a decision run with the intent to train adaptive analytics models, the Mode must be set to: ‘Make decision and store data for later response capture’. This ensures that all the input data used for a decision, together with the result of the decision, is stored for a limited amount of time using an internal process. This data is used later while capturing customer responses. Running the ‘Make Decision’ data flow simulates 10,000 customers visiting the website and being presented with the top 1 credit card offer banner. The data flow leverages the Next-Best-Action strategy, which is running behind the U+ Bank website, so all Contact Policy rules including Eligibility, Applicability and Suitability are considered. Due to these Contact Policy rules, you can see that from the 10,000 customers approximately 7000 offers are made. The rest of the customers do not qualify for any offers. To view the results of the run, navigate to the pxDecisionResults data set.
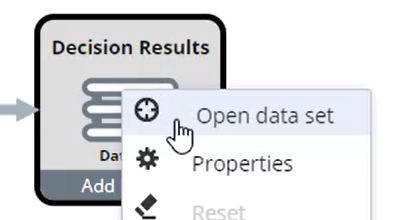
This is the input data used during a decision for the customer with pxSubjectID 1683. In this case, the customer will get the RewardsCard offer, which is also stored in this data set. Populating the ‘pxDecisionResults’ data set is the desired result of this data flow, so the destination component is not relevant; you can set it to ‘Abstract’.
The ‘CaptureResponse’ data flow simulates the customer response to the decision made, matches the response with the decision data and sends it to adaptive analytics to train the models.
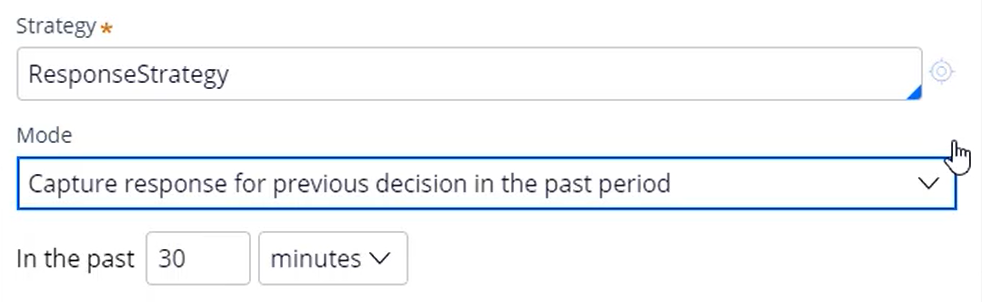
Like the ‘MakeDecision’ data flow, it uses the ‘CustomerData’ data set as its source. The ‘Decision Strategy’ component uses a Response Strategy to simulate a customer response. The mode should reflect this and be set to ‘Capture response for previous decision in the past period’.
To demonstrate adaptive learning, the ‘ResponseStrategy’ is built to manipulate the customer responses. The External Input component ingests the data from the DecisionResults data set containing the decision results. The ‘Response Strategy’ then uses scorecards to correlate specific customer properties with customer behavior. As an example, the scorecard for the ‘RewardsCard’ offer gives a higher score to customers in their 30s than in their 50s.

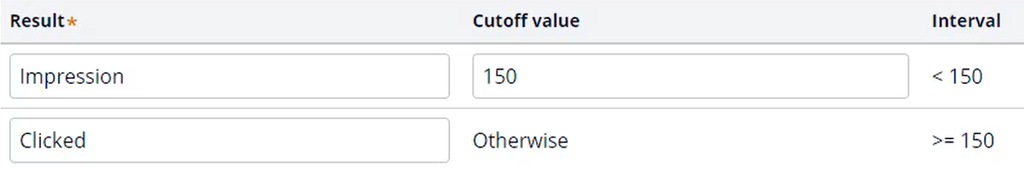
It also gives a higher score to customers with high average spending. Once a score for a customer is determined, use a Cutoff value for simulating responses. Customers with a score above the Cutoff value are considered interested in the credit card offer, the others not.
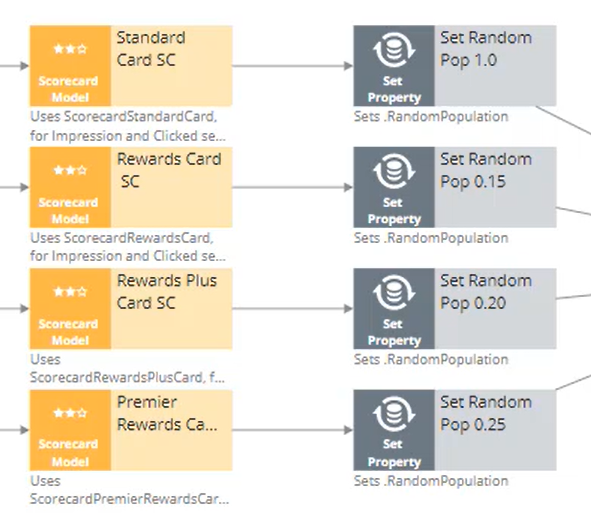
Identification of the manipulated customer properties as strong predictors of customer behavior would demonstrate the accuracy of the adaptive model’s learning process. Back to the response strategy: after simulating customer responses using the scorecards, you can apply some randomization during the learning process. For example, consider the Standard Card as acting purely randomly, whereas the Rewards Plus card will be random in only 15% of the cases because it uses the score-based simulated responses in the other 85%.
The identification of the Standard Card as a low-performing model, and the Rewards card as a high-performing model would demonstrate the accuracy of the learning process. The destination of the ‘Capture Response’ process is the ‘pxAdaptiveAnalytics’ data set. This data set is used by the Adaptive Decision Manager (or ADM) to update the adaptive models. Start the ‘Capture Response’ process. You can see that while the data flow is executed on the same 10,000 customers, only the customers who get an offer are sent to adaptive analytics for learning.
The adaptive model used for determining the Next-Best-Action is the ‘Web_Click_Through-Rate’ adaptive model. For each credit card banner a model has been created, and each model has learned from the customer responses.
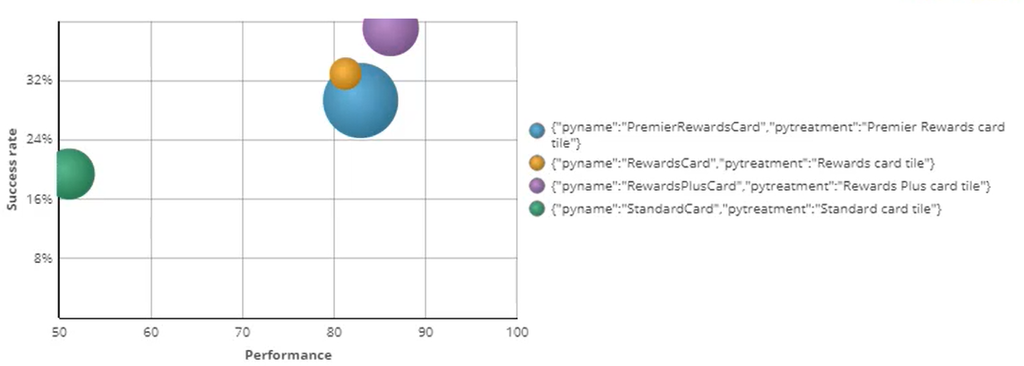
Notice that the lowest performing model is the Standard Card, with an accuracy of close to 50%. This is the equivalent of random binary behavior. The other cards perform much better than that. This is as expected, since you used less random responses to train them. To verify that the models pick up on strong predictors, open the Model report for the ‘RewardsCard’ offer.
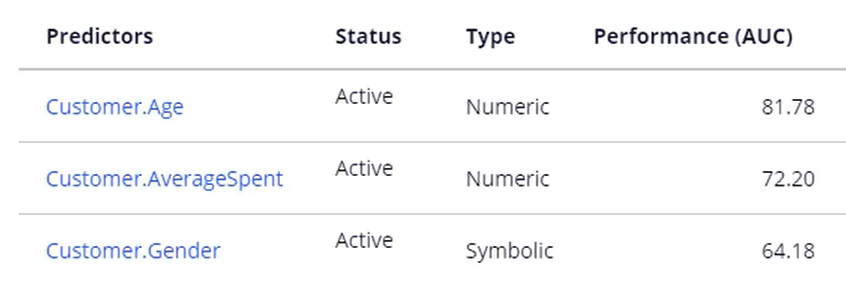
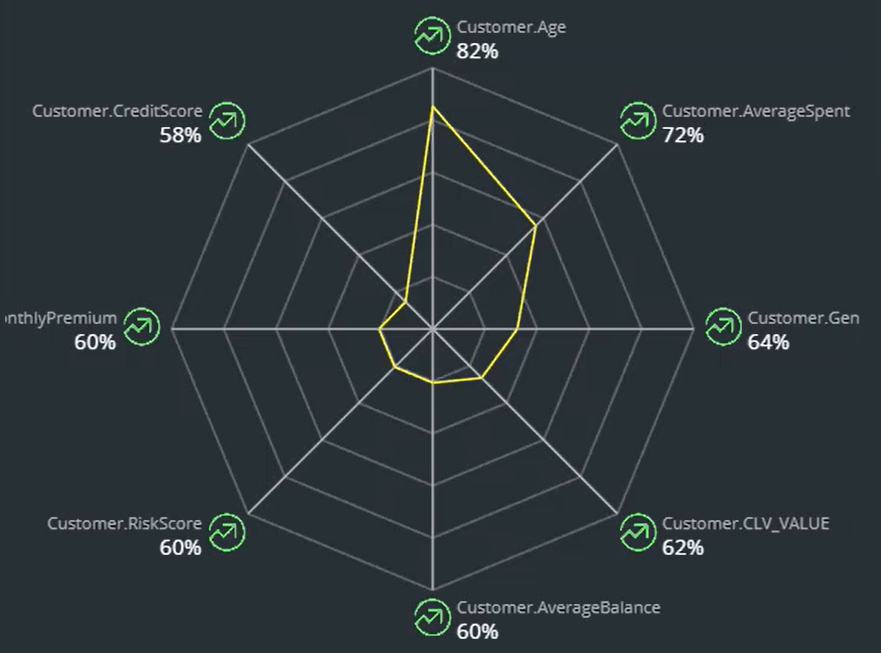
Three customer properties are manipulated in the response strategy score cards: Age, Gender and Average Spending. They have been correctly picked up by adaptive learning as the best performing predictors for this model.
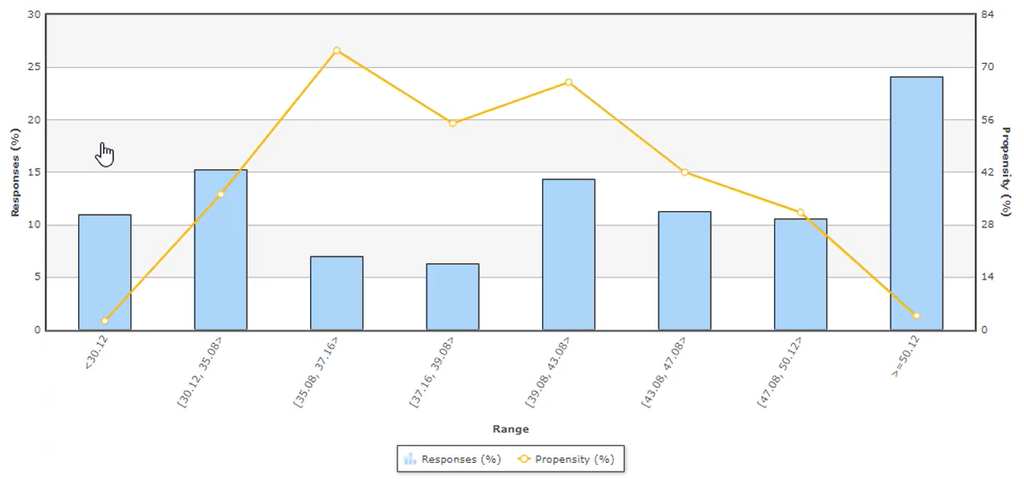
Also, the Customer Age predictor shows a high propensity for customers in their 30s and a low propensity for customers in their 50s.
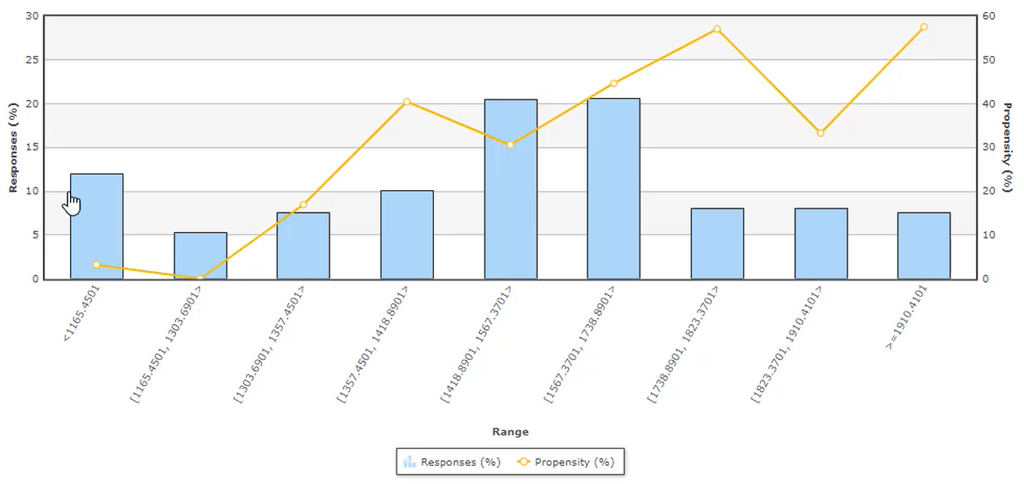
The customer’s Average Spent predictor shows an increasing propensity for a higher average spend value.
For an overview of the model and the best predictors, navigate to the RewardsCard Action. On the Treatment tab, click on the Cosmos icon next to the Rewards card tile web Treatment.
This demonstrates that the adaptive models accurately learn from customer responses.
You have reached the end of this demo. What did it show you?
- How to use a Monte Carlo data set as customer data for demonstrating the adaptive learning process.
- How to set up and run a ‘Make Decision’ data flow to generate Next-Best-Action decisions configured in the Next Best Action Designer.
- How to set up and run a ‘Capture Response’ data flow to simulate customer responses and train adaptive models.
- How to demonstrate that adaptive models accurately pick up on strong predictors of customer behavior.