Pega Value Finder Simulation
What is a value finder simulation?
A value finder simulation allows you to engage more empathetically by identifying and profiling “under-served” customers, then suggesting actions for improvement – like adjusting engagement policies or creating new actions and treatments.
Using Pega Value Finder, you can discover areas in which you can improve the next-best-action strategy by monitoring scenarios in which customers are presented with no actions or only low-propensity actions. This is particularly useful when planning new changes or optimizing existing parameters.
Value Finder identifies and profiles “under-served” customers. These are customers that either do not receive actions, or only receive actions they have a low propensity to accept. It analyzes what happens at every stage of the next-best-action decision funnel, enabling you to:
- View offer distribution to well-engaged, under-engaged, or not-engaged customers
- Identify top opportunities for improvement
- Review details of under-served groups at each level of arbitration
Consider an example in which a bank runs a value finder simulation and identifies groups of not-engaged and under-engaged customers. The details of the groups and how to address the findings are as follows:
Not-engaged customers: There are 7000 under-served customers, none of whom own a credit card. They all have credit scores over 650 but are blocked because the eligibility rules in place keep them from seeing specific offers they have a high propensity for. In this case, you might want to tweak the engagement policy to present them with more appropriate offers.
Under-engaged customers: There are 5000 customers that have good credit scores and own a credit card but have no propensity scores higher than 5%. You might need to create a new offer with different terms and test it to see if you can capture their attention.
Analyzing customer distribution using a value finder simulation
Transcript
This demo will show you how to analyze customer distribution using a value finder simulation.
U+, a retail bank, has recently implemented a project in which credit card offers are presented to qualified customers when they log in to the self-service web portal. The bank would like to check if there are any un-served or under-served customers and find ways to serve them better.
This is the Pega Customer Decision Hub™ portal.
In Discovery, you can create a new value finder simulation.
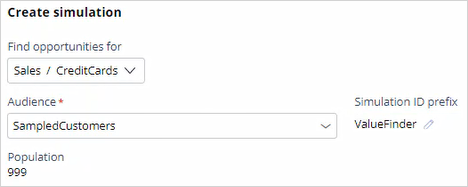
To create a value finder simulation run, select the issue and group in which you would like to find opportunities. Then, select an audience on which you would like to do the simulation run. The audience is a list of potential target customers. You can modify the simulation name as required to easily identify the specific runs.
Once the simulation run is complete, Value Finder indicates several opportunities.
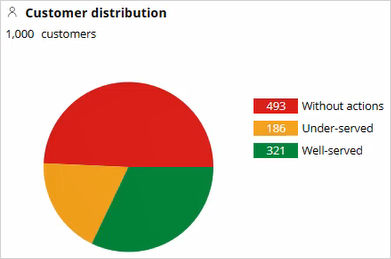
The pie chart displays the cumulative numbers of customers without actions, under-served customers, and well-served customers. The Without actions category indicates the number of customers who received no actions. The Under-served category indicates the number of customers who received low propensity actions. The Well-served category indicates the customers who received high propensity actions.
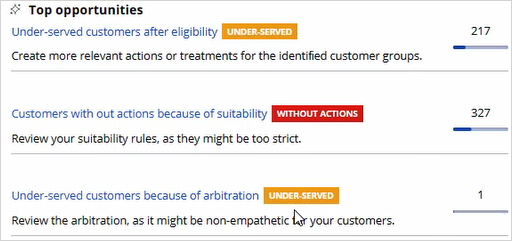
Value Finder identifies a number of opportunities for improving the Next-Best-Action Strategy. However, it displays the top three opportunities only.
The first opportunity represents a group of customers that are under-served due to eligibility conditions. The second opportunity indicates the stage of your Next-Best-Action strategy at which customers are prevented from receiving actions. In this example, it is after suitability. The third opportunity shows the number of customers who are under-served due to low propensity actions.
In this case, notice that there are 217 customers who are under-served because they have no relevant actions or treatments, and 327 customers who have no actions because the suitability condition may be too strict.
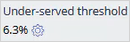
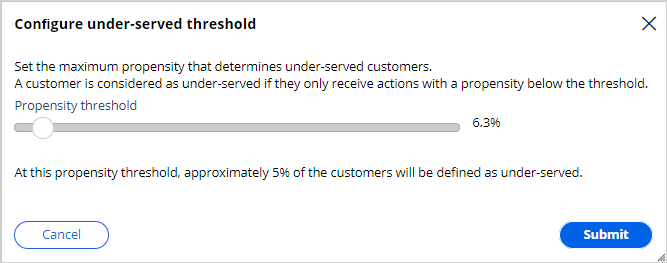
Value Finder identifies customers as under-served if the propensity of every action and treatment available to the customer is below the threshold propensity. To provide a convenient starting point, the propensity threshold value is initially chosen in such a way that 1 out of 20 customers is defined as under-served. In this case, this results in an under-served threshold of 6.3%.
If the business would like to present offers with a higher propensity, this threshold value can be changed.
Details are provided for ‘Under-served groups after eligibility’ to show which eligibility conditions are contributing to the issue.
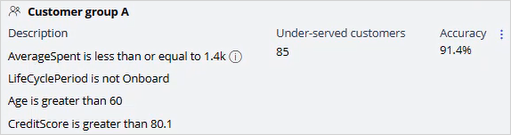
Value Finder provides the following information about each group:
Description: Group characteristics such as Age or LifeCycle Period.
Under-served customers: The number of under-served customers in the group.
Accuracy: The number of under-served customers in the group divided by the total number of customers in the group. If the accuracy is 100%, this means that all customers in the group are under-served. If the accuracy is lower, for example, 91.4%, this means that 91.4% of the customers in the group are under-served. The remaining 8.6% have at least one action above the propensity threshold.
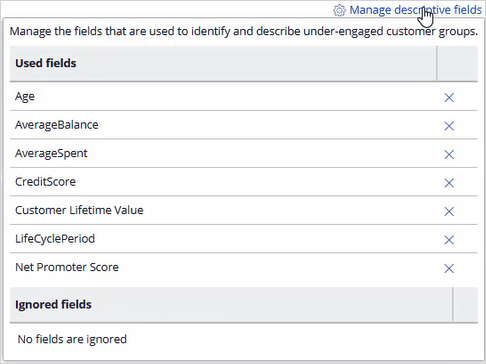
You can also manage the group by removing a field from the description. Typically, the system lists all potential fields available for the Next-Best-Action Strategy. You can decide to remove a field from the list if it’s not a required field. For example, if the business does not want to categorize customers based on age to avoid discrimination, they can remove the Age field from the list. If a field is removed, Value Finder then recalculates the values for Under-served customers and Accuracy.
Also, you can save or export the customer groups identified as under-served as audiences.
You can then run distribution tests to get more insight into the current actions that these audiences receive. Use the Value Finder recommendations and your distribution test results as feedback for business stakeholders to inspire them to create new actions and treatments that will be relevant to these customers.
Let’s now look at the WITHOUT ACTIONS customer category to understand how the customers are filtered. The filtration that happens in this simulation is similar to a funnel filtration for every engagement policy condition type. In this case, the total number of customers in the audience is 1000. Thus, the input population considered for the eligibility conditions is 1000. When the eligibility conditions are applied, 11 customers do not receive any actions. Thus, 1000-11 = 989 customers who pass through the eligibility level. The output population of the eligibility level is passed on as the input to the next level.
The input population for the applicability conditions is therefore 989. When the applicability condition is applied, 155 customers do not receive an action. Thus, 989-155 = 834 customers who pass through the applicability level.
The input population for the suitability conditions is therefore 834. When the suitability condition is applied, 327 customers do not receive an action.

In this specific scenario, 327 customers are presented with no actions due to the suitability condition. When you click on Suitability under the WITHOUT ACTIONS customer category, you can view the suggested recommendation for providing more customers with actions. Use this information from the Value Finder to run a funnel filtration on an audience simulation to detect at which level the suitability condition is preventing customers from receiving an action. That is, whether it is the suitability condition at the group level or the action level.
This demo has concluded. What did it show you?
- How to configure and run a value finder simulation.
- What are the top three opportunities identified by the Value Finder.
- How to interpret the customer group in the under-served customer category.
- How to interpret the without actions customer category.
- How to interpret the under-served customer category.
This Topic is available in the following Module:
If you are having problems with your training, please review the Pega Academy Support FAQs.
Want to help us improve this content?